
The Weekend Read
Issue one · 11 October 2026
|
|
|
A note to fellow Mondegars
Something new. Once in a while we are going to take a single company, read everything on the public record about it, do the arithmetic ourselves, and send you the whole case. Not a tip and not a headline. The actual argument, with every number traced to a filing so you can check us.
This is the first one. We have started with Meta because it is the company our members ask about most, and because the argument about its AI spending is being had with the wrong numbers.
Three things, and then we will get out of the way:
• Tell us who to do next. Write to support@mondegar.ai and we will put your company in the queue. Ask us for the detailed workings on this one and we will send them.
• Follow us on X. The short findings go out there every day, long before they reach an email like this. @mondegara1
• Get the app. Everything below, the technicals, the filings, what Congress owns, six lists of ideas, is in there and refreshed daily. Download it free.
|
|
Meta Platforms
Is the AI spending worth it?
META · $718.67 · market cap $1.83tn · 52-week range $520.26 to $779.82
Sources: Meta Form 8-K Q2 2026 · 120 SEC Form 4 filings · Argus 7 Oct · LSEG 9 Oct · MarketEdge 9 Oct · Mondegar holdings, disclosure and sentiment data
|

|
OUR CALL: BUY, BUT AVERAGE IN
If you own Meta, keep it. If you don't, start buying now, but in instalments rather than all at once.
$719 is the price today. $815 is what we think it is worth. $624 is what it is worth if the AI spending fails. $677 is where we think your average cost should end up.
Put a quarter of your intended position in at today's price, and a further quarter at $690, at $660 and at $640. If all four fill, your average cost is $677, which turns 13% upside against 13% downside into 20% upside against 8% downside. Same company, same view, better entry, and you own some of it from today in case it never comes back.
1. What Meta is actually doing in AI
Three separate efforts, with very different economics, and investors tend to blur them.
Superintelligence Labs builds the models. It is a cost centre with no direct revenue, funded out of the advertising business, and it is the reason capital spending has gone vertical.
Reality Labs builds headsets and smart glasses. It lost $4.6 billion in the June quarter alone and has now lost well over $60 billion cumulatively. Management has begun describing it as an AI hardware effort rather than a metaverse one, which is a repositioning, not a turnaround.
Muse is the new one, and the only one with a price list. Launched 8 September 2026 in the United States, on iOS, Android, the web and inside WhatsApp, it is a personal agent rather than a chatbot: it books things, shops, manages a calendar, acts on your behalf. It has held the top of the iOS App Store since shortly after release, and according to Human Security it was already the single largest source of agent traffic on the internet last month, with agent traffic tripling in a month largely because of it.
Underneath it all sits the spending. Capital expenditure was $31.1 billion in the June quarter, with $130 to $145 billion guided for the full year. For perspective, Meta's entire revenue in 2021 was $117.9 billion.
2. How Muse should be thought about in the valuation
This is where most of the commentary goes wrong in one direction or the other, so here is the arithmetic.
On 9 September, the day after launch, Meta traded at $613.48. It is $718.67 today. On 2.55 billion shares that is $268 billion of market value added, and in that window not a single piece of financial information improved. The June quarter, the only one reported, showed profit falling. So the $268 billion is the market's valuation of Muse.
The right question is not whether Muse is clever. It is whether $268 billion is the right price for it.
| 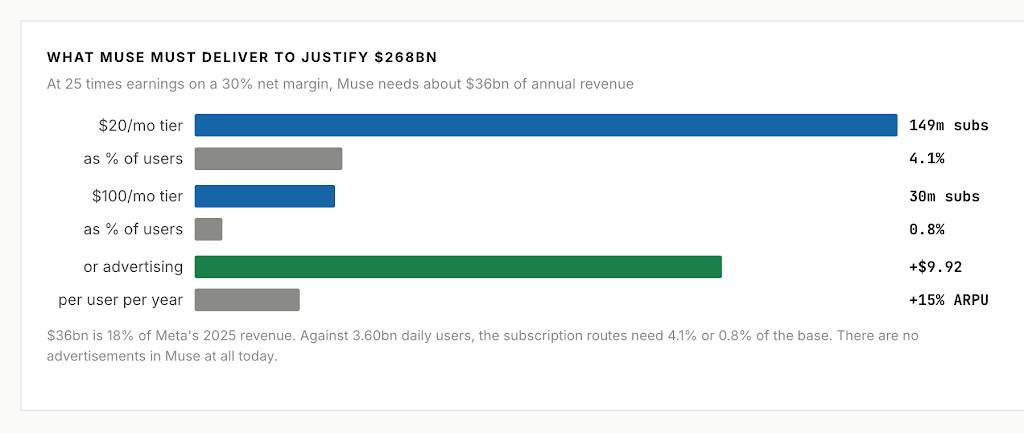 | |
That is demanding but it is not fantasy, and that matters. Four percent of Meta's user base paying $20 a month is a large business, but Meta has converted a larger share than that to new behaviours before. Nought point eight percent on the $100 tier is a smaller ask than it sounds. And a 15% lift in advertising revenue per user, in a product where Meta has not yet placed a single advertisement, is the kind of thing this company has done repeatedly.
The second question is whether serving it bankrupts them. Meta gives free users 100 million tokens a week, which at its own developer prices looks like roughly $1,100 a year of computing against $68 of revenue per person. We worked out how much of each allowance a user can consume before Meta is underwater, at a realistic twenty cents per million tokens served.
| 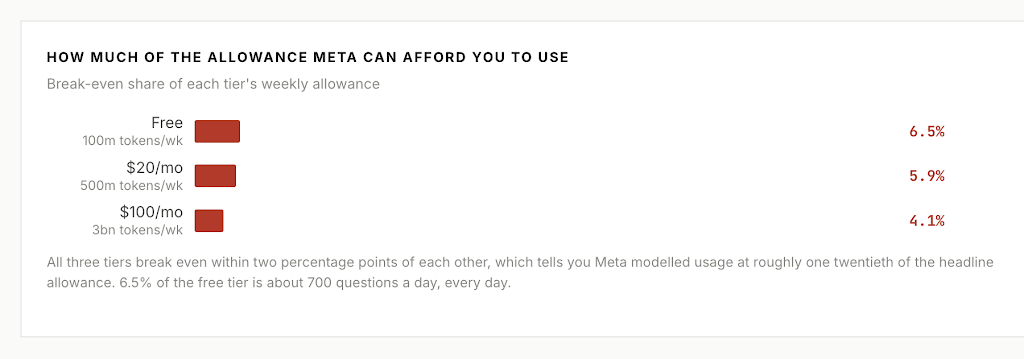 | |
So the giveaway is not the problem. Nobody will use 700 prompts a day, and on the free tier Meta is very probably profitable. The genuine exposure is the $100 tier, where an agent runs unattended and consumes tokens without anyone typing. And the cost of serving a token has fallen roughly a thousandfold in four years, which shrinks the whole problem over the life of the investment.
Muse is not what will damage Meta's profits. The $145 billion of data centres already has.
3. The financials, in detail
| 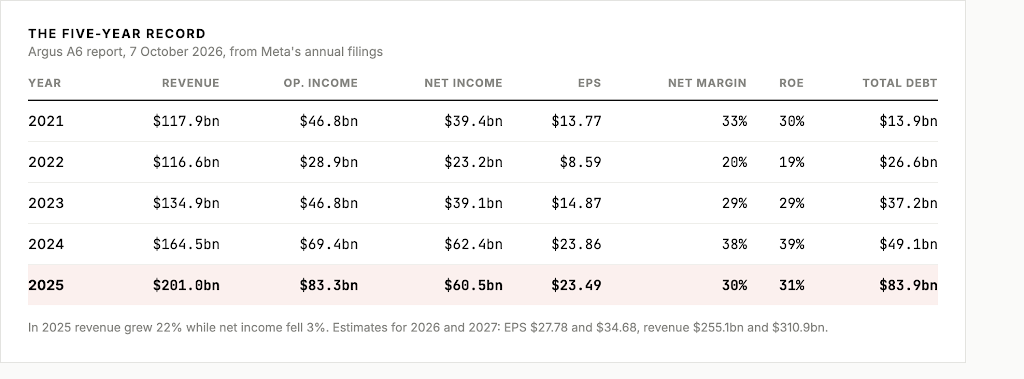 | |
Revenue has compounded 72% in three years. Operating income grew in 2025 too, to $83.3 billion. But look at the shaded row: net income fell 3% while revenue grew 22%, because interest expense is now real and below-the-line costs are rising. Outside the 2022 advertising recession, when revenue was also falling, Meta had never gone backwards on profit in a growth year.
| | |
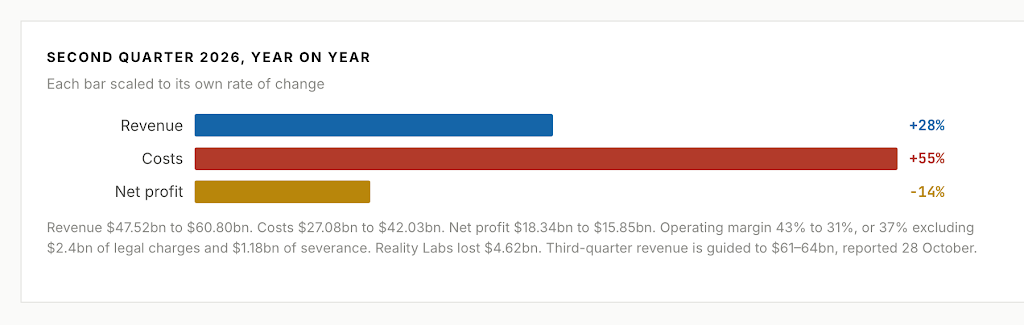
The June quarter made it sharper.
|  | |
And the balance sheet, which used to be an irrelevance in any discussion of Meta, is now part of the story.
| | |
| 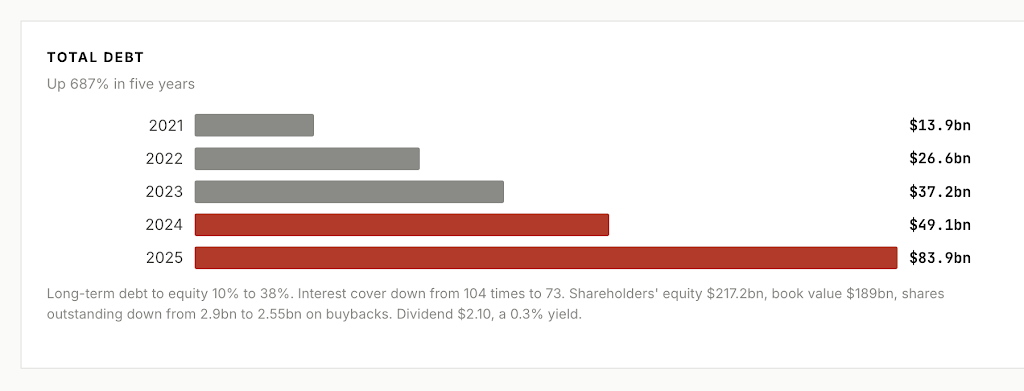 | |
Meta is not financially stretched. Interest cover of 73 times is enormous and it still holds $81.6 billion of cash. But a company that funded itself entirely from operations for a decade is now borrowing, and that is a change in character worth noticing rather than a crisis.
All of it, the five-year record, the margins, the cash against the debt, is in the app under any ticker you search. We did not build these charts for this article. We built them for the product, and then used them.
4. The technicals
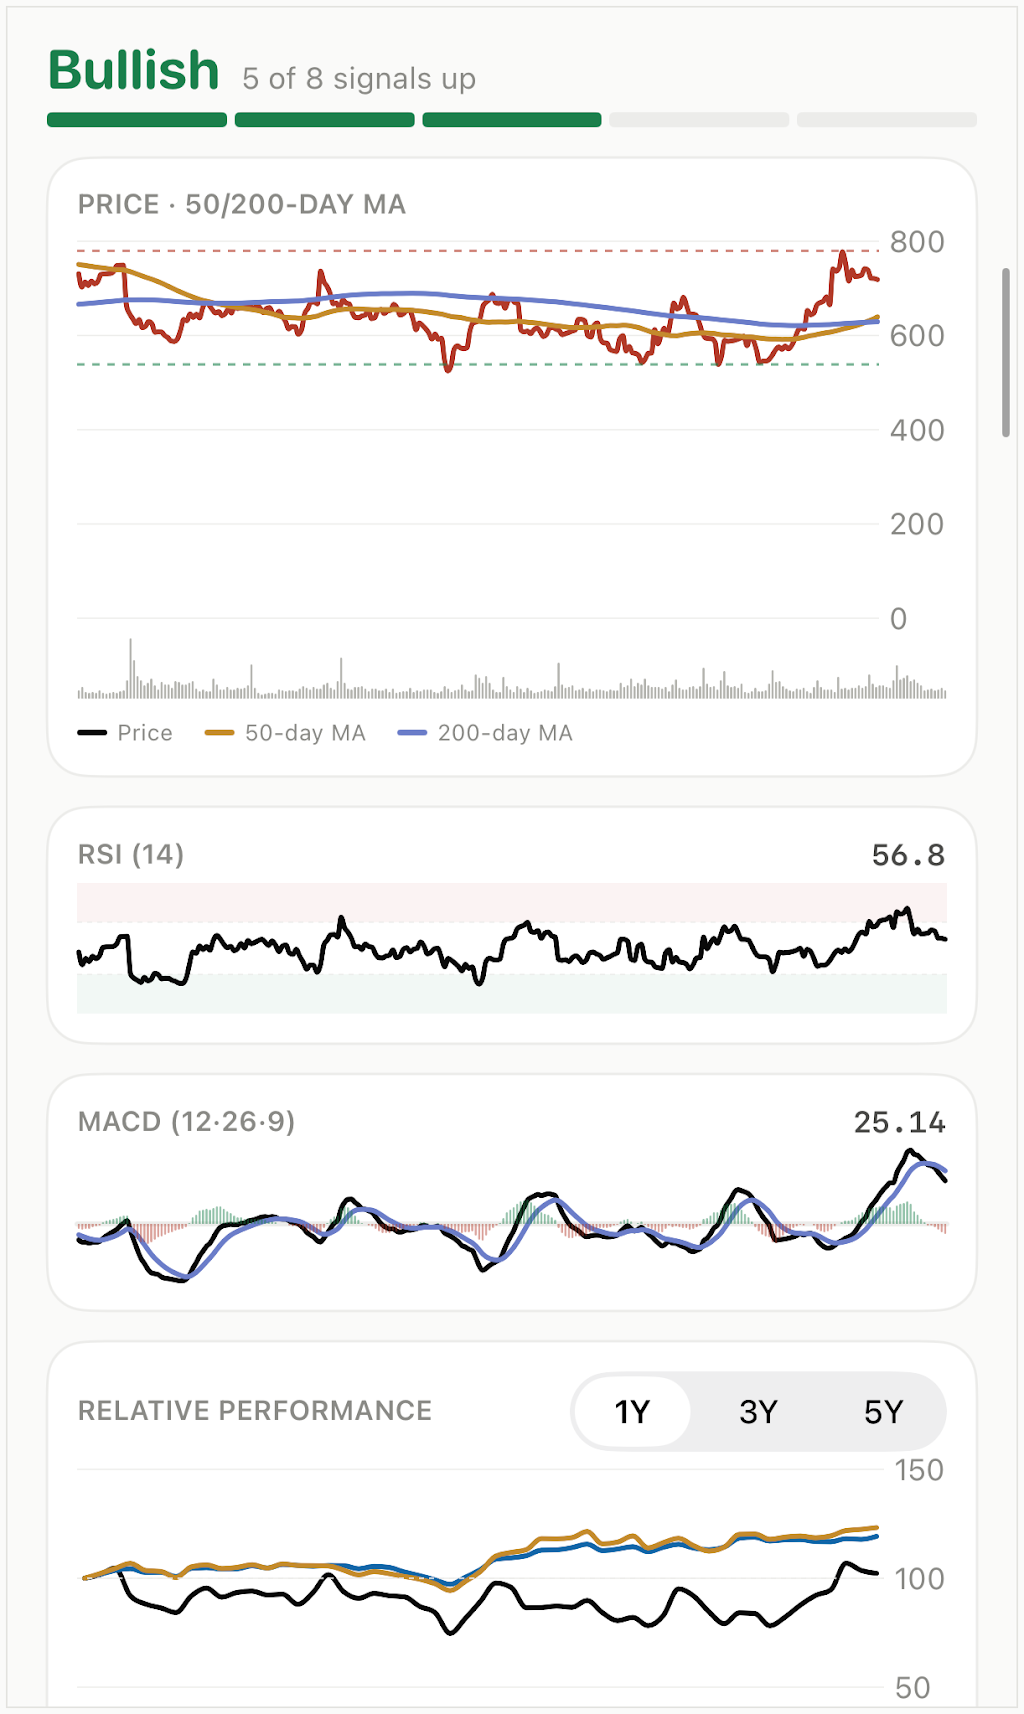
We do not trade on charts, but we do use them to decide when to act on a view, and here they are unusually constructive.
|  | |
|  | |
Every chart in this section comes straight from the Mondegar app. Look up any ticker and you get the same: price against both moving averages, RSI, MACD, relative performance, and our own eight-signal read, updated every day.
The trend is intact and the stock is being accumulated, with more volume on up days than down over the last fifty sessions. It is also short-term oversold, which in a rising trend is usually an entry rather than a warning. The single negative is the money-flow slope.
Two numbers are worth writing down together. Eighteen times 2027 earnings is $624. The 200-day average is $630. Our valuation floor and the stock's own trend support sit $6 apart.
5. Who owns it
Institutions hold 79% of Meta. Our filings data tracks 19 of them with $236.5 billion between them, and the direction of travel splits by type of investor.
| 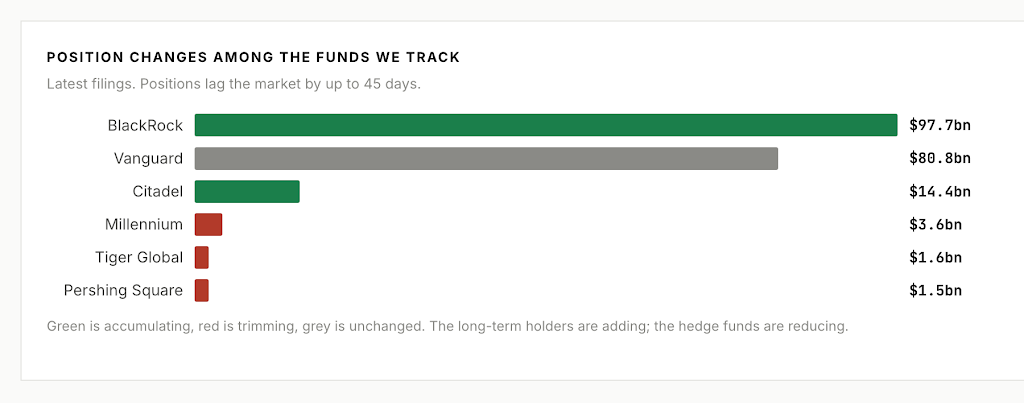 | |
You can pull this for any company yourself. Search a ticker in the app and the 13F holders, who added, who trimmed, and what Congress owns are all on the same page.
In Washington, four of the members we track hold it. Donald Trump's disclosed range of $7.25m to $32.6m is the largest, alongside Josh Gottheimer, Michael McCaul and Marjorie Taylor Greene.
Inside the company, ten officers and directors sold $234.4 million of stock this year across 260 sales, and nobody made an open-market purchase. In fairness, 253 of those 260 ran on 10b5-1 plans filed months in advance, so almost none of it was a decision about today's price. These people are paid in stock and selling is how they are paid. The absence of buying is the softer but more durable observation.
6. What everyone else says
| 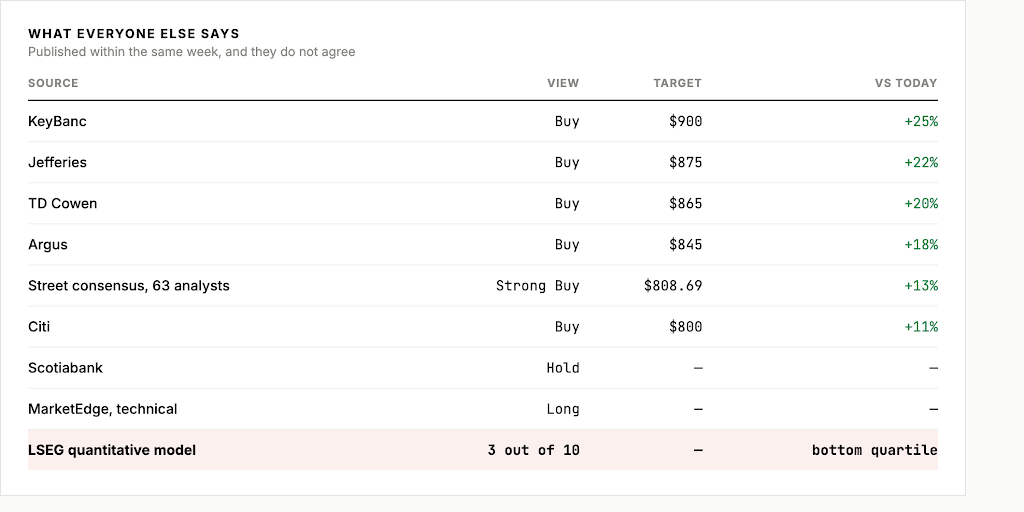 | |
The sell side is close to unanimous. The quantitative model is the outlier and deserves a hearing: it scores Meta 3 out of 10 against Alphabet's 10 and Amazon's 7, and that score has fallen from 6 since April on earnings, risk and insider trading. It is not reading the future, it is reading the record, and the record has deteriorated.
The market itself has refused to pick a side. Meta returned 0.42% over the past year while the index returned 15.7%, and then rose 17% in a month on a product launch.
7. The bull case and the bear case
The bull case
- 20.7 times 2027 earnings on a PEG of 0.98, for 28% revenue growth, an 82% gross margin and a 30% return on equity. That is a market multiple for a better-than-market business.
- Muse needs roughly 4% of the user base at $20 a month to justify what the market has already paid. Large, but Meta has converted bigger shares to new behaviour before.
- There is not a single advertisement in Muse yet, in the one discipline Meta is world-class at.
- Serving costs have fallen about a thousandfold in four years, so the unit economics improve on their own.
- Technically in an uptrend, above rising 50 and 200-day averages, under accumulation, and short-term oversold.
- BlackRock and Citadel are adding. Institutions own 79%. Six of seven brokers say buy.
The bear case
- Net profit fell in 2025 and fell 14% again last quarter. Operating margin has gone from 43% to 31%.
- Costs grew 55% against revenue of 28%. There is no operating leverage at all right now.
- Debt has risen 687% in five years to $83.9bn to fund spending that has not yet earned a dollar.
- Reality Labs lost $4.6bn in one quarter with no path to profit disclosed.
- Ten insiders sold $234m and not one bought, at any price from $520 to $780.
- The LSEG model scores it bottom quartile and falling, and the shares have gone nowhere for a year.
- $268bn of market value is already riding on a product that is one month old and US-only.
8. Our perspective
Meta is a high-quality business in its most expensive year, and the market has already rewarded the AI story once. Both halves of that sentence matter.
We value the shares at $815, which is 23.5 times 2027 earnings of $34.68. That is 13% above today and lands within a few dollars of a Street consensus we arrived at independently, which gives us some confidence in it. The bull target of 25 times gives $867; the bear case of 18 times gives $624.
| 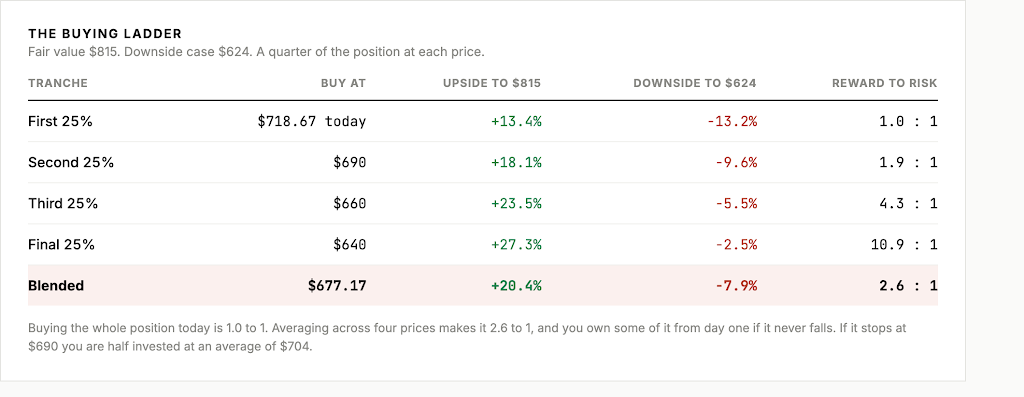 | |
So: we are buyers, but we are not paying $719 for the whole position. At today's price you earn 13% for being right and lose 13% for being wrong, which is a coin toss. Averaging in across four prices down to $640 blends your cost to $677, where the same two outcomes become +20% and -8%. That is 2.6 to 1, and it is a position worth having.
The 17% run since 9 September is what took this from an easy decision to a close one. A month ago, at 17.7 times 2027 earnings, this note would have said buy the lot. Someone else worked that out first, which is how markets are supposed to work. Averaging in is how you stay involved without pretending you know what happens next.
Meta is not one of our four Value Picks today. Once the average cost is under $680 and one quarter shows costs growing slower than revenue, it becomes one.
Three things we are watching, all checkable without anyone's opinion:
- One quarter where costs grow more slowly than revenue. Third-quarter results are on 28 October. This is the single most important number in the release, more than revenue or earnings per share.
- Advertising appearing inside Muse. That is the moment the $268 billion starts being earned rather than hoped for.
- An insider buying with their own money. Transaction code P on a Form 4. There has not been one all year.
How we did this
Insider figures come from all 120 Form 4 filings made by Meta insiders between 1 January and 10 October 2026, parsed from the XML, keeping transaction codes P and S; plan status is the aff10b5One checkbox. Quarterly accounts are from Meta's Form 8-K for the quarter ended 30 June 2026. Five-year history and the 2026 and 2027 estimates of $27.78 and $34.68 are from the Argus A6 report of 7 October 2026. Quantitative scores, peer scores, institutional ownership and the one-year return are from the LSEG detailed stock report of 9 October 2026. Technical levels are from MarketEdge Second Opinion for the week ended 9 October 2026. Muse allowances and prices are Meta's own, announced 8 September 2026; the serving cost of $0.20 per million tokens is the midpoint of published 2026 inference economics at scale, and the break-even conclusion moves with it. Holdings, Congressional disclosures and sentiment are Mondegar data as at 10 October 2026, and institutional positions lag the market by up to 45 days. Shares outstanding of 2.55bn are derived from market capitalisation and price.
What would change our mind
Upward: a quarter of operating leverage, advertising inside Muse, or a genuine code-P insider purchase. Downward: a fourth consecutive quarter of costs outgrowing revenue, metering or rate limits appearing on the $100 tier, or a break below the 200-day average at $630. We revisit after third-quarter results on 28 October.
Nothing here is advice to buy or sell. Please make your own decisions. |
|
Want the full workings?
Every figure above traces to a filing, and we are glad to show you the derivation, the model and the sensitivities behind any of them. Write to
support@mondegar.ai and we will send you the detailed analysis.
We will send one of these every few weeks, one company at a time. If there is a stock you would like us to pull apart, tell us and we will put it in the queue.
Ask us for the detail
|
|
|
All of this lives in the app
The technical charts above, the 13F holdings, what Congress owns and six lists of stock ideas are all in the Mondegar app, refreshed every day. There is a short note each morning about the shares you actually own, and a button on every screen to ask it why. Free with your membership.
Get the Mondegar app
And follow @mondegara1 on X, where we post the findings as we make them.
|
|
|
Nothing in this email is advice to buy or sell. Please make your own decisions.
MONDEGAR.AI
|
|